
Businesses hire more workers rather than invest in productivity.
Clyde Caruana, Minister for Finance
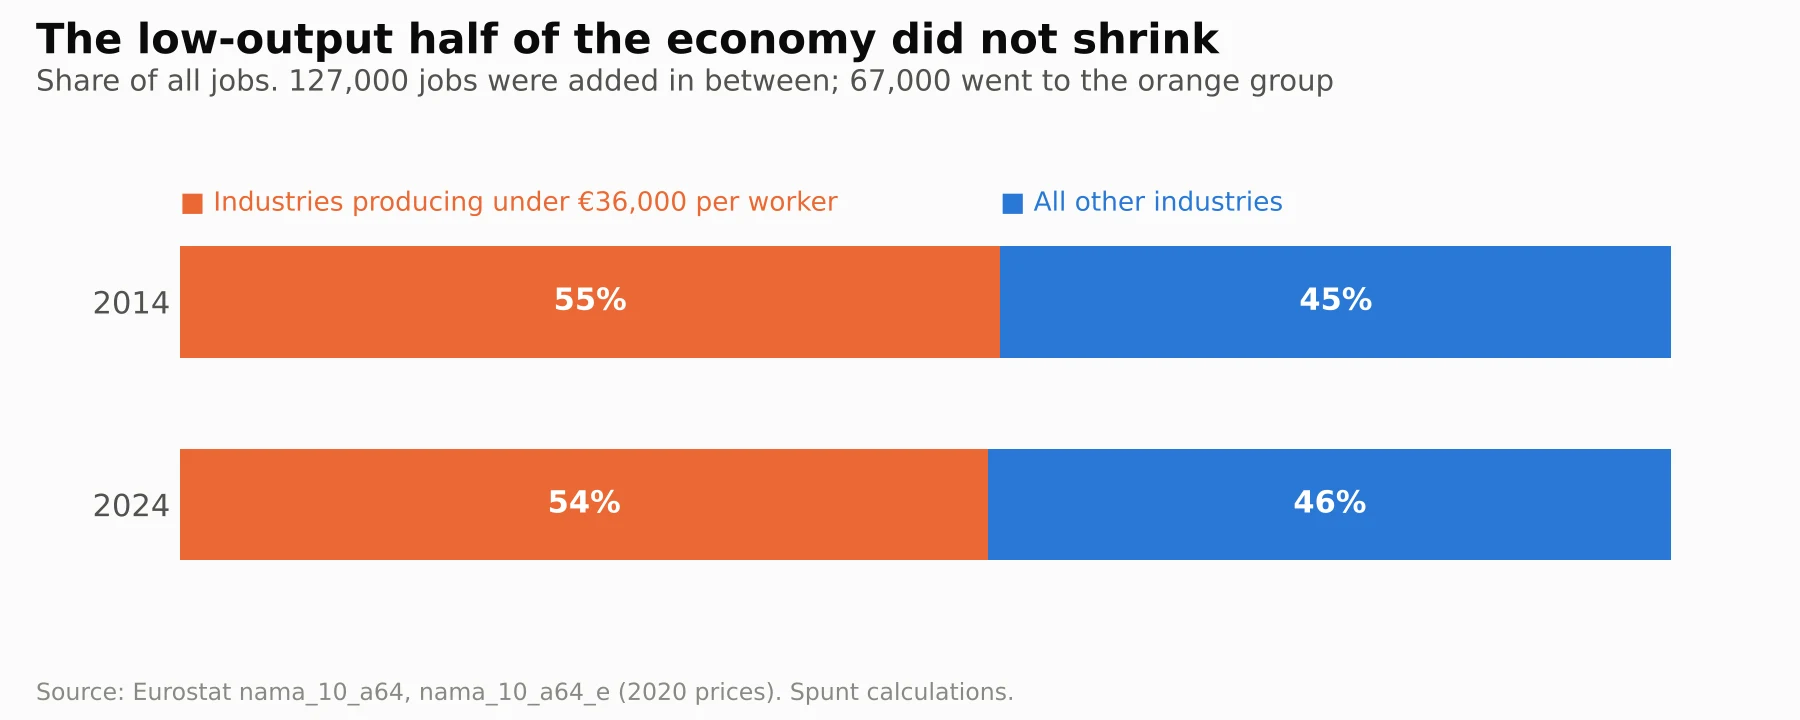
Across the whole economy, the equipment behind each Maltese worker rose by 6% between 2014 and 2024, which looks better than the EU. But that average is pulled up by a few capital-heavy activities in finance, administrative services and real estate. In the rest of the economy, which holds more than four in five jobs, equipment per worker fell by 8% while the workforce grew by 57%, five times worse than the EU. The problem sits in the biggest part of the economy: industries producing under €36,000 a year per worker still hold more than half of all jobs and took about 67,000 of the 127,000 new ones.How we reached this verdict ↓
Analysis and evaluation
The minister is right about most of Malta’s businesses. Over the past decade they invested a lot, but almost all of it went into equipping extra workers rather than giving each worker more to work with. In construction, employment nearly doubled while the equipment behind each worker fell by more than a third and output per worker did not move.
No dataset records why a business hires instead of investing, so the motive cannot be checked. What can be checked is the result the claim predicts. If businesses choose people over machines, the amount of equipment behind each worker should stay flat or fall while the number of workers rises.
What “equipment per worker” means
Add up everything businesses and the state use to produce things: buildings, machines, vehicles, equipment and software. Leave out people’s homes. Divide by the number of people in work. Economists call this capital per worker. This fact check calls it equipment per worker for short. Eurostat publishes the figures for Malta at fixed 2020 prices, so inflation does not distort them.
The headline figure looks fine
In 2014 Malta had about €77,000 of equipment behind each worker. By 2024 it had about €81,400. That is a rise of 6%, during ten years in which the number of people in work rose by 64%.
On its own, 6% is not bad. Across the EU, equipment per worker fell by 1.4% between 2014 and 2023, as investment stayed weak after the financial crisis. On the headline figure, Malta did better than most of Europe.
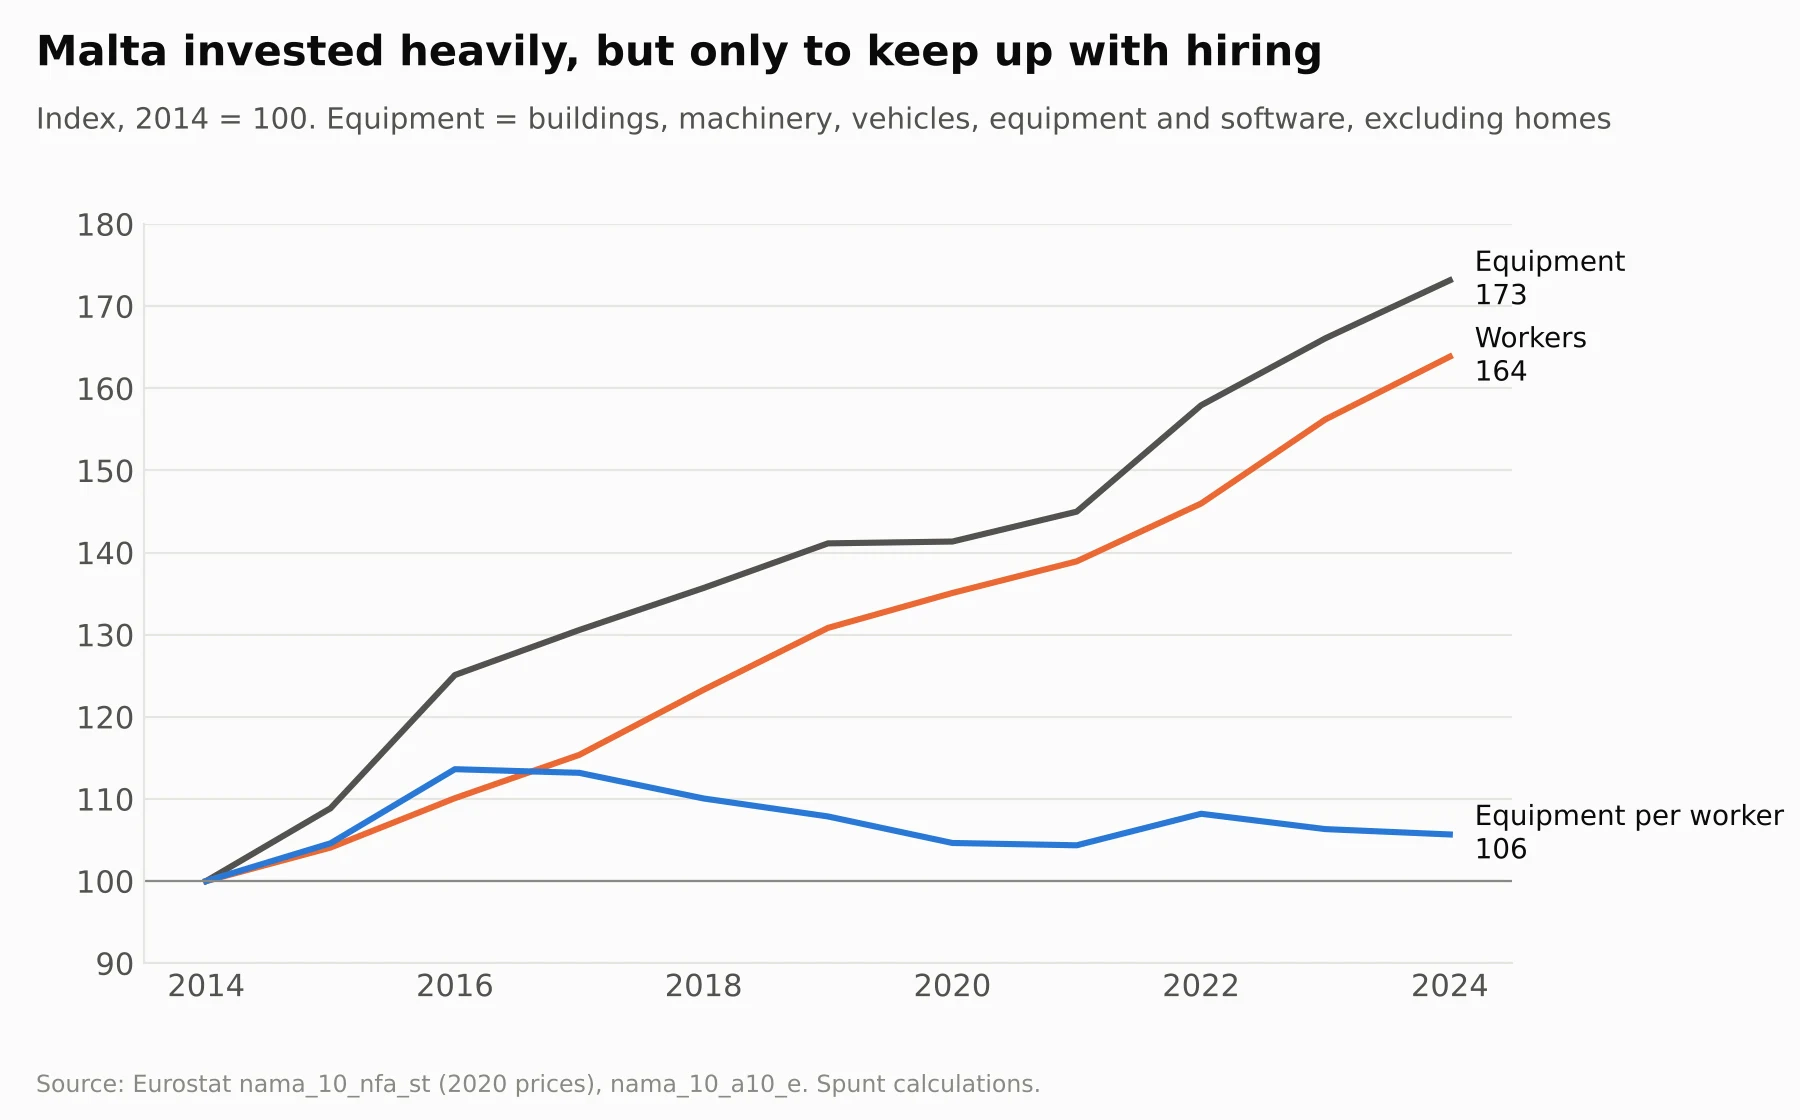
Why the headline figure misleads
The national figure is an average, and an average can be pulled up by a small group.
Picture a street of ten houses. Nine families each give up a room to take in a lodger. The tenth family builds a mansion. The average house on the street is now bigger, even though nine out of ten got smaller.
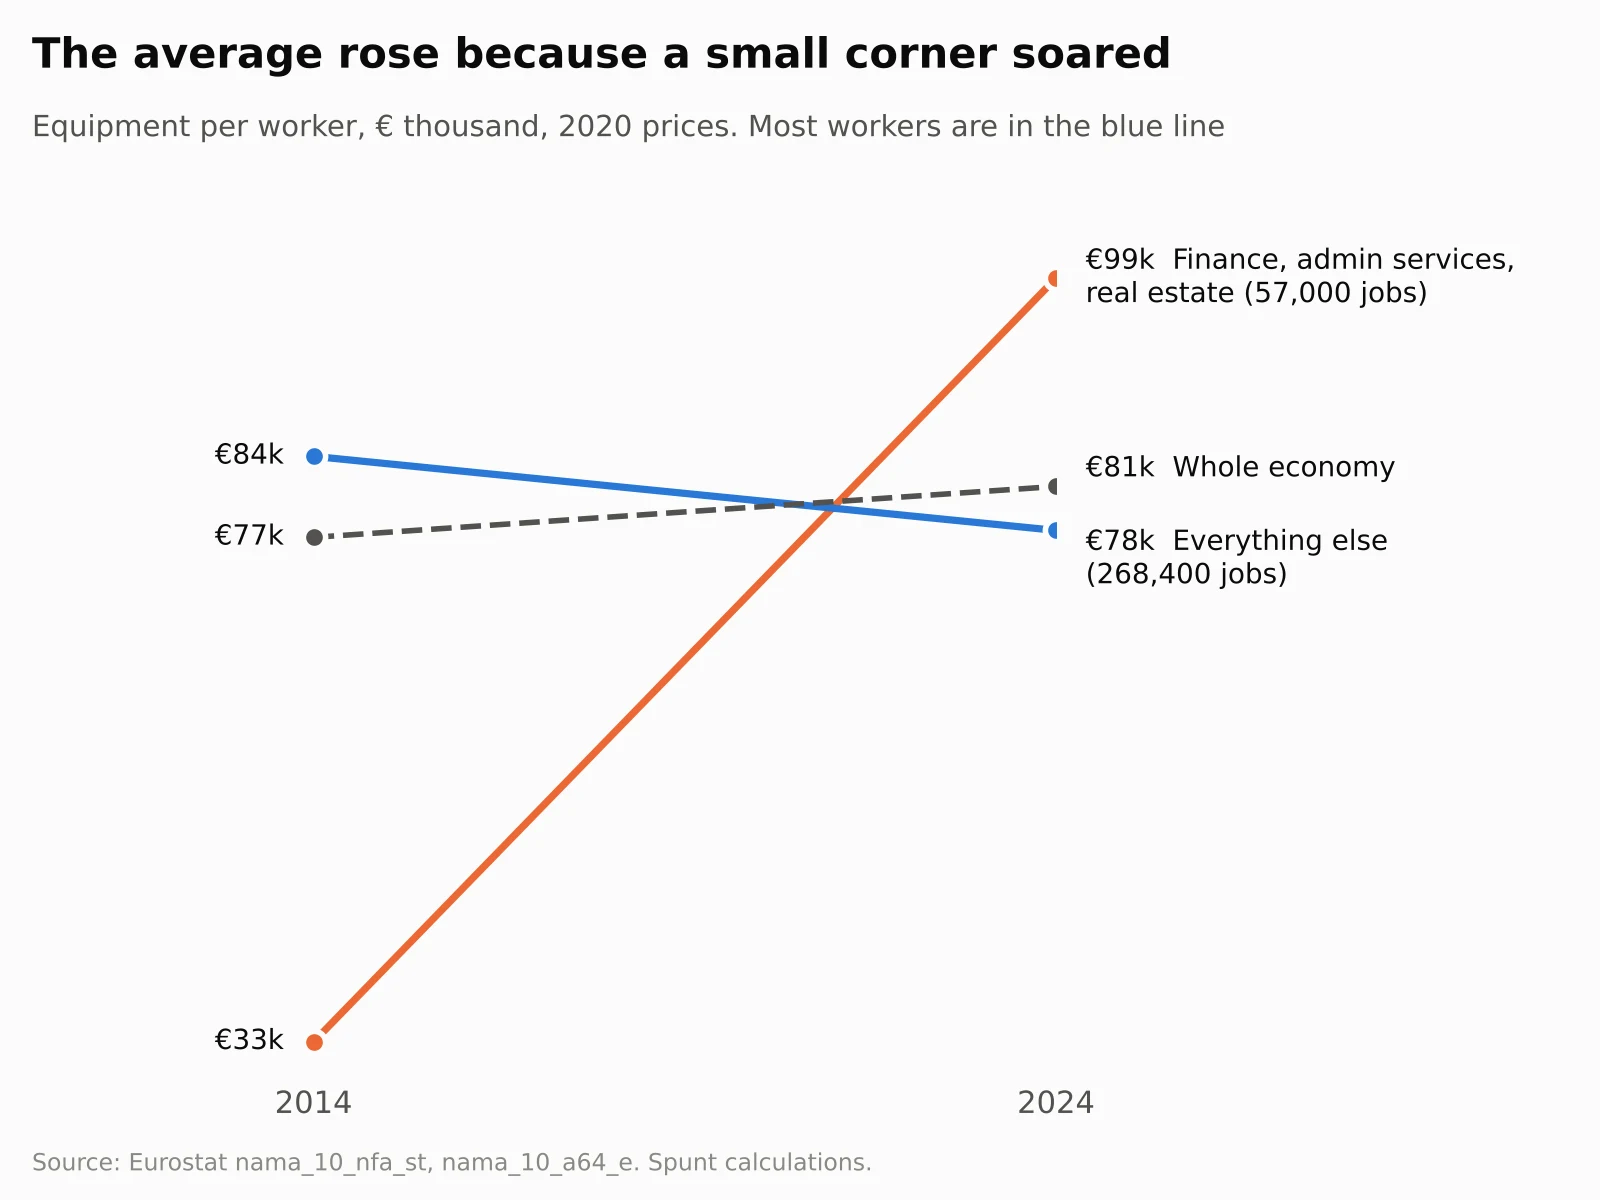
That is roughly what happened in Malta. A small group of activities in finance, administrative services (which include renting and leasing out equipment) and real estate piled up equipment very quickly without hiring many people. The rest of the economy did the opposite.
| Equipment, 2014 | Equipment, 2024 | Workers, 2014 | Workers, 2024 | Equipment per worker | |
|---|---|---|---|---|---|
| Finance, administrative services, real estate | €0.9bn | €5.7bn | 27,400 | 57,000 | €33,000 → €99,000 |
| Everything else | €14.4bn | €20.8bn | 171,200 | 268,400 | €84,000 → €77,600 |
| Whole economy | €15.3bn | €26.5bn | 198,600 | 325,400 | €77,000 → €81,400 |
Net fixed assets excluding dwellings, chain-linked 2020 euro, divided by persons employed. Source: Eurostat nama_10_nfa_st and nama_10_a64_e; Spunt calculations.
The small group’s equipment grew more than sixfold while it added fewer than 30,000 workers. Most of that came from administrative services, where equipment rose from €338 million to €3.6 billion. That one jump is enough to lift the national average.
In the rest of the economy, equipment grew by 45% while the workforce grew by 57%. Each worker ended up with less: €77,600 in 2024, against €84,000 in 2014, a fall of 8%. More than four in five jobs are in this part of the economy.
Against the rest of Europe
Compare like with like and Malta looks worse. The table runs to 2023, the latest year with figures for every country.
| Growth in workers, 2014 → 2023 | Equipment per worker, whole economy | Equipment per worker, excluding finance, administrative services, real estate | Equipment per worker in 2023 | |
|---|---|---|---|---|
| Malta | +56% | +6.3% | −7.6% | €82,000 |
| EU | +11% | −1.4% | −1.5% | €114,000 |
| Euro area | +12% | −2.8% | −2.8% | €124,000 |
| Cyprus | +37% | −10.8% | −11.6% | €70,000 |
| Portugal | +16% | −7.8% | −7.2% | €69,000 |
| Slovenia | +18% | −7.9% | −8.9% | €93,000 |
| Germany | +7% | −3.2% | −2.0% | €125,000 |
| Estonia | +14% | +21.9% | +16.4% | €95,000 |
Same measure and sources as above, plus Eurostat nama_10_a10_e. Amounts are in euro at 2020 prices and are not adjusted for differences in price levels between countries.
Three things stand out.
Malta hired faster than anyone. Its workforce grew by 56% in nine years, five times the EU rate and the fastest of the 37 countries Eurostat covers.
Malta did invest. Its stock of equipment grew by about 5.5% a year, far faster than most of Europe. But almost all of that went into equipping the extra people.
Where most people work, Malta fell behind. Outside finance, administrative services and real estate, equipment per worker fell by 7.6%, against 1.5% across the EU. Cyprus, the EU country closest to Malta in the pace of hiring, fell further. Estonia shows the other path: slower hiring, and 16% more equipment per worker.
Malta also starts from a lower base. In 2023 it had about €82,000 of equipment per worker, against €114,000 across the EU.
No EU country hired as fast as Malta
Change in equipment per worker against growth in the number of workers, 2014–2023. Each dot is a country.
Show the data as a table
| Country | Growth in workers | Equipment per worker, whole economy | Excluding finance, admin services, real estate | Equipment per worker, 2023 |
|---|---|---|---|---|
| Malta | +56.2% | +6.3% | −7.6% | €82,000 |
| Cyprus | +36.6% | −10.8% | −11.6% | €70,000 |
| Ireland | +35.3% | +67.3% | +113.9% | €287,000 |
| Luxembourg | +29.3% | −5.6% | −6.6% | €218,000 |
| Spain | +18.9% | −10.2% | −10.9% | €124,000 |
| Slovenia | +17.8% | −7.9% | −8.9% | €93,000 |
| Netherlands | +17.0% | −2.7% | −5.9% | €139,000 |
| Portugal | +15.9% | −7.8% | −7.2% | €68,000 |
| Greece | +15.3% | −18.1% | −18.1% | €48,000 |
| Hungary | +14.0% | +5.1% | +3.4% | €92,000 |
| Sweden | +13.8% | +8.5% | +6.8% | €187,000 |
| Estonia | +12.0% | +21.9% | +16.4% | €95,000 |
| Belgium | +11.4% | +4.1% | +3.0% | €165,000 |
| Lithuania | +11.4% | +21.9% | +20.2% | €78,000 |
| Poland | +11.4% | +16.2% | +13.0% | €35,000 |
| Austria | +10.9% | −1.1% | +0.1% | €186,000 |
| EU | +10.7% | −1.4% | −1.5% | €114,000 |
| France | +10.6% | −1.4% | −0.4% | €116,000 |
| Slovakia | +9.5% | −13.5% | −15.4% | €87,000 |
| Italy | +8.0% | −8.3% | −9.6% | €121,000 |
| Germany | +7.4% | −3.2% | −2.0% | €125,000 |
| Croatia | +6.6% | +17.3% | +20.7% | €121,000 |
| Latvia | +5.2% | +15.8% | +12.8% | €73,000 |
| Romania | −1.6% | +44.5% | +46.1% | €82,000 |
Sector by sector
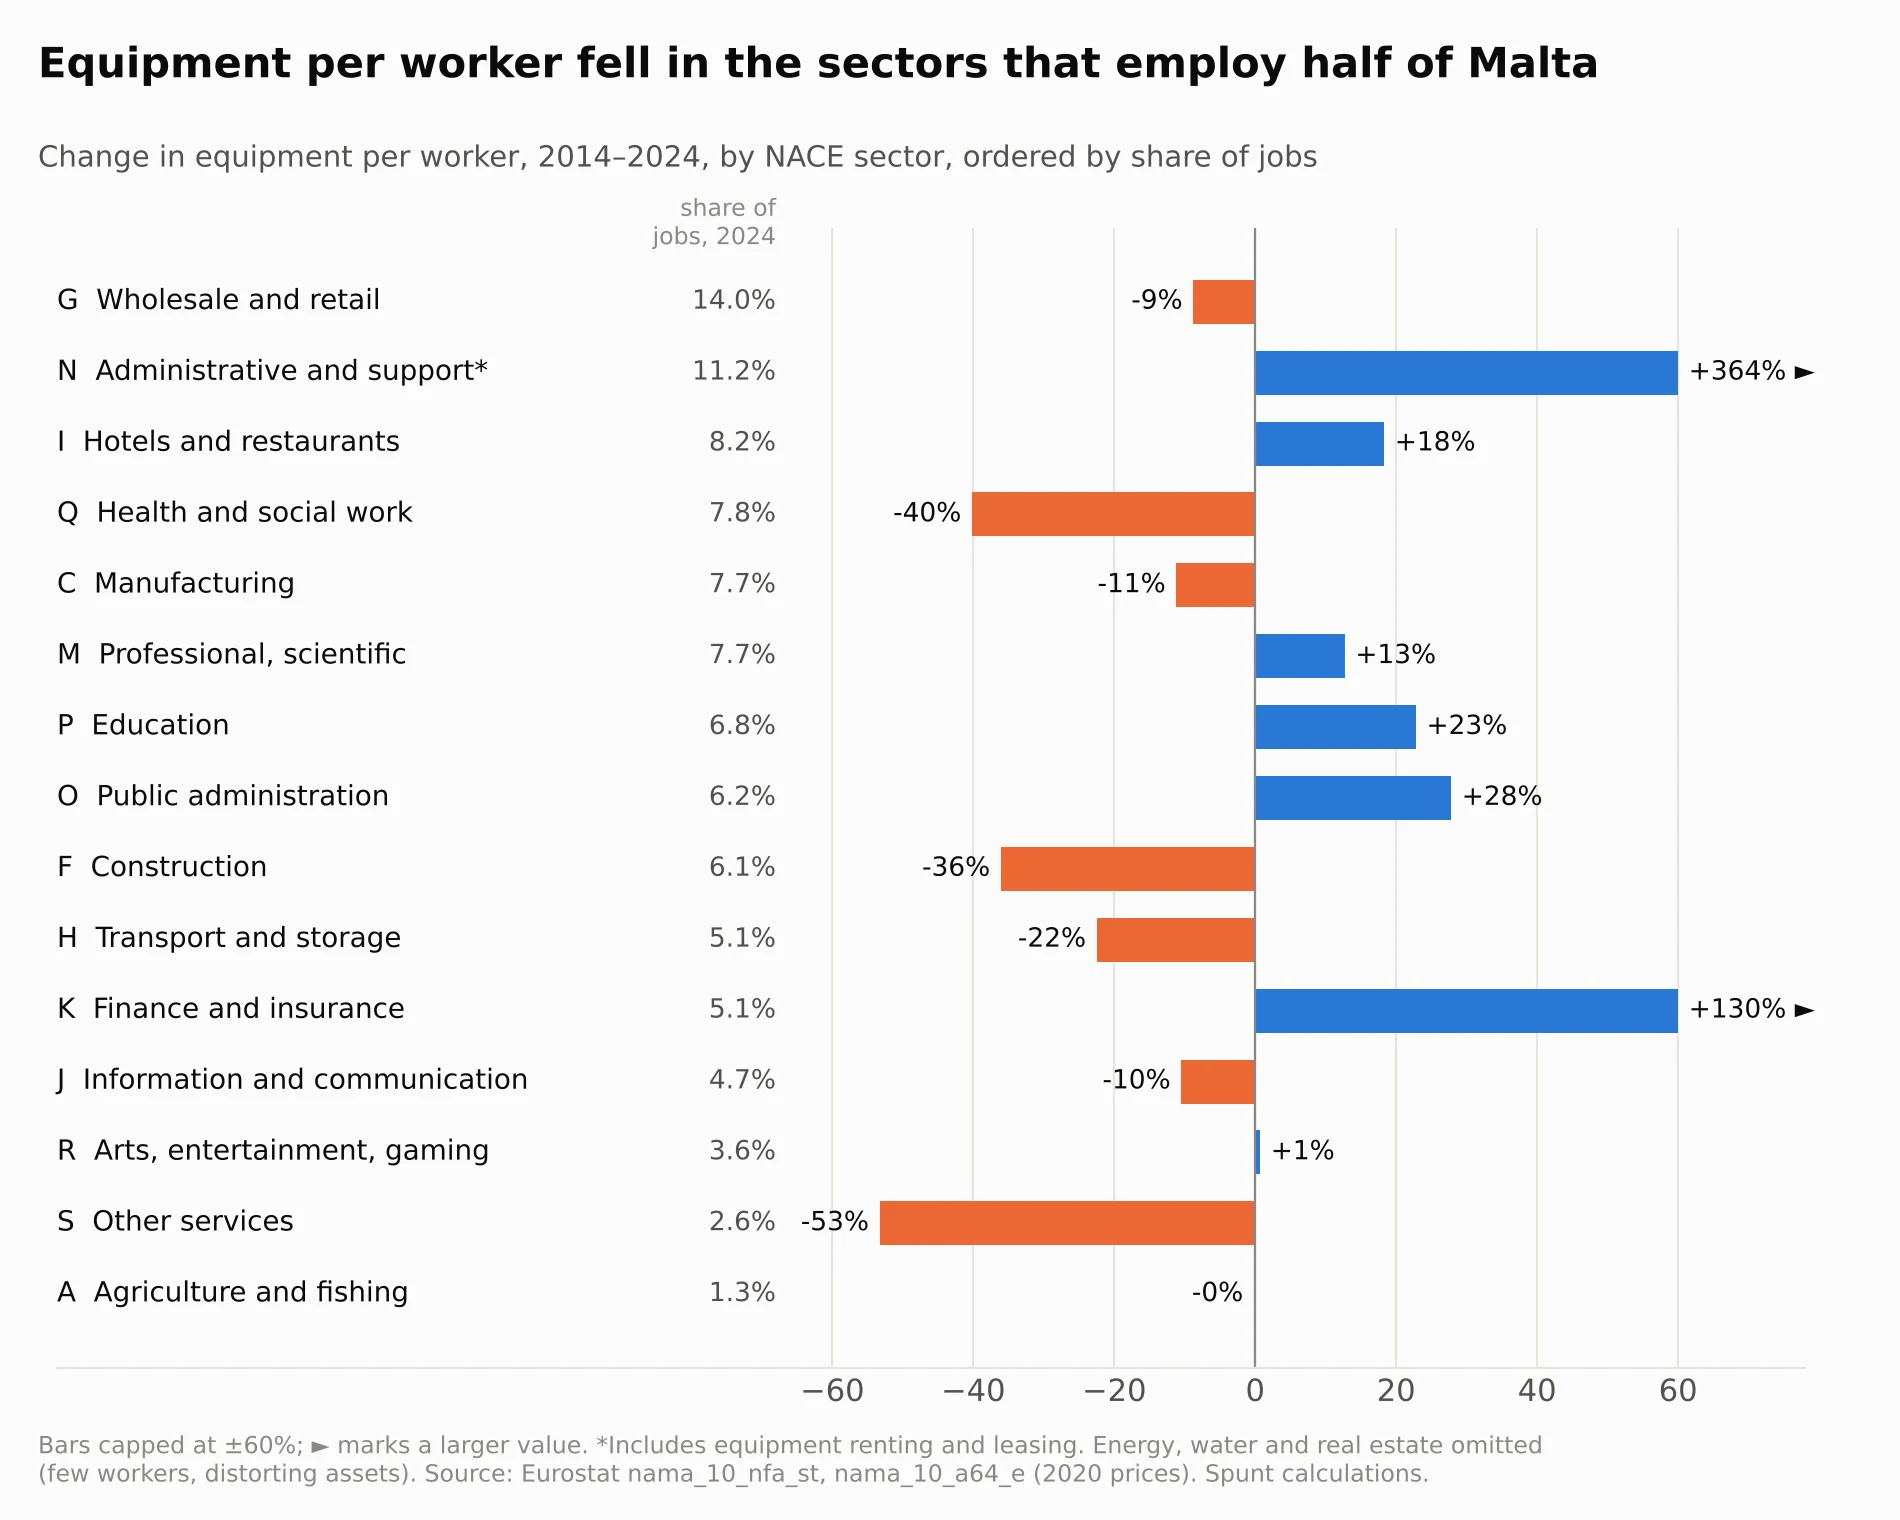
Eurostat publishes Malta’s equipment figures for 18 sectors, the top level of the EU’s industry classification (NACE). That is the most detailed breakdown available for equipment. Jobs and output are published in more detail, and the next section uses that.
| Sector (NACE) | Share of all jobs, 2024 | Share of new jobs, 2014–24 | Equipment per worker, 2014 → 2024 | Output per worker, 2014 → 2024 |
|---|---|---|---|---|
| G Wholesale and retail | 14.0% | 12.1% | €36k → €33k (−9%) | €28.4k → €30.0k |
| N Administrative and support | 11.2% | 16.1% | €21k → €98k (+364%)* | €26.7k → €44.2k |
| I Hotels and restaurants | 8.2% | 6.3% | €44k → €53k (+18%) | €23.8k → €35.5k |
| Q Health and social work | 7.8% | 8.0% | €65k → €39k (−40%) | €39.6k → €39.5k |
| C Manufacturing | 7.7% | 2.9% | €87k → €77k (−11%) | €43.7k → €46.3k |
| M Professional, scientific, technical | 7.7% | 11.3% | €38k → €43k (+13%) | €58.5k → €66.8k |
| P Education | 6.8% | 3.9% | €27k → €33k (+23%) | €37.6k → €33.5k |
| O Public administration | 6.2% | 4.7% | €159k → €203k (+28%) | €41.3k → €46.3k |
| F Construction | 6.1% | 7.2% | €77k → €49k (−36%) | €33.5k → €34.0k |
| H Transport and storage | 5.1% | 5.4% | €173k → €134k (−22%) | €37.4k → €48.8k |
| K Finance and insurance | 5.1% | 5.2% | €37k → €86k (+130%) | €77.0k → €85.5k |
| J Information and communication | 4.7% | 6.7% | €123k → €110k (−11%) | €83.9k → €155.7k |
| R Arts, entertainment, gaming | 3.6% | 4.9% | €91k → €92k (+1%) | €204.4k → €109.6k |
| S Other services | 2.6% | 2.7% | €50k → €23k (−53%) | €20.2k → €20.1k |
| A Agriculture and fishing | 1.3% | 0.6% | €56k → €56k (0%) | €43.6k → €44.5k |
| L Real estate | 1.3% | 2.2% | €132k → €158k (+20%) | not comparable** |
| E Water and waste | 0.6% | 0.3% | €496k → €613k (+24%) | €42.8k → €68.5k |
| B, D Quarrying, electricity, gas | 0.2% | −0.5% | €1.25m → €2.94m | not comparable*** |
Equipment: net fixed assets excluding dwellings, chain-linked 2020 euro, per person employed. Output: gross value added per person employed, chain-linked 2020 euro. Source: Eurostat nama_10_nfa_st, nama_10_a64 and nama_10_a64_e; Spunt calculations. *Administrative and support includes equipment renting and leasing, which employs about 2,250 people. **Real estate output includes the imputed rent of owner-occupied homes. ***Energy and quarrying employ very few people and hold very large assets, so per-worker figures swing wildly.
Equipment per worker fell in eight sectors: wholesale and retail, health and social work, manufacturing, construction, transport, ICT, other services and agriculture. Together they hold half of all jobs.
Which sectors dragged the national figure down depends on two things: how far their own figure fell and how many people they employ. Weighting each sector’s change by its share of jobs, the four biggest drags were health and social work, transport, construction and manufacturing. Between them they pulled the national average down by about €6,500 per worker. It was pushed back up mainly by energy, administrative services (leasing), public administration and finance, which together employ just over one worker in five.
Is the problem in a small corner or a big part of the economy?
This matters. A problem confined to an industry that employs a few hundred people changes little. A problem in an industry that employs tens of thousands shapes the whole economy.
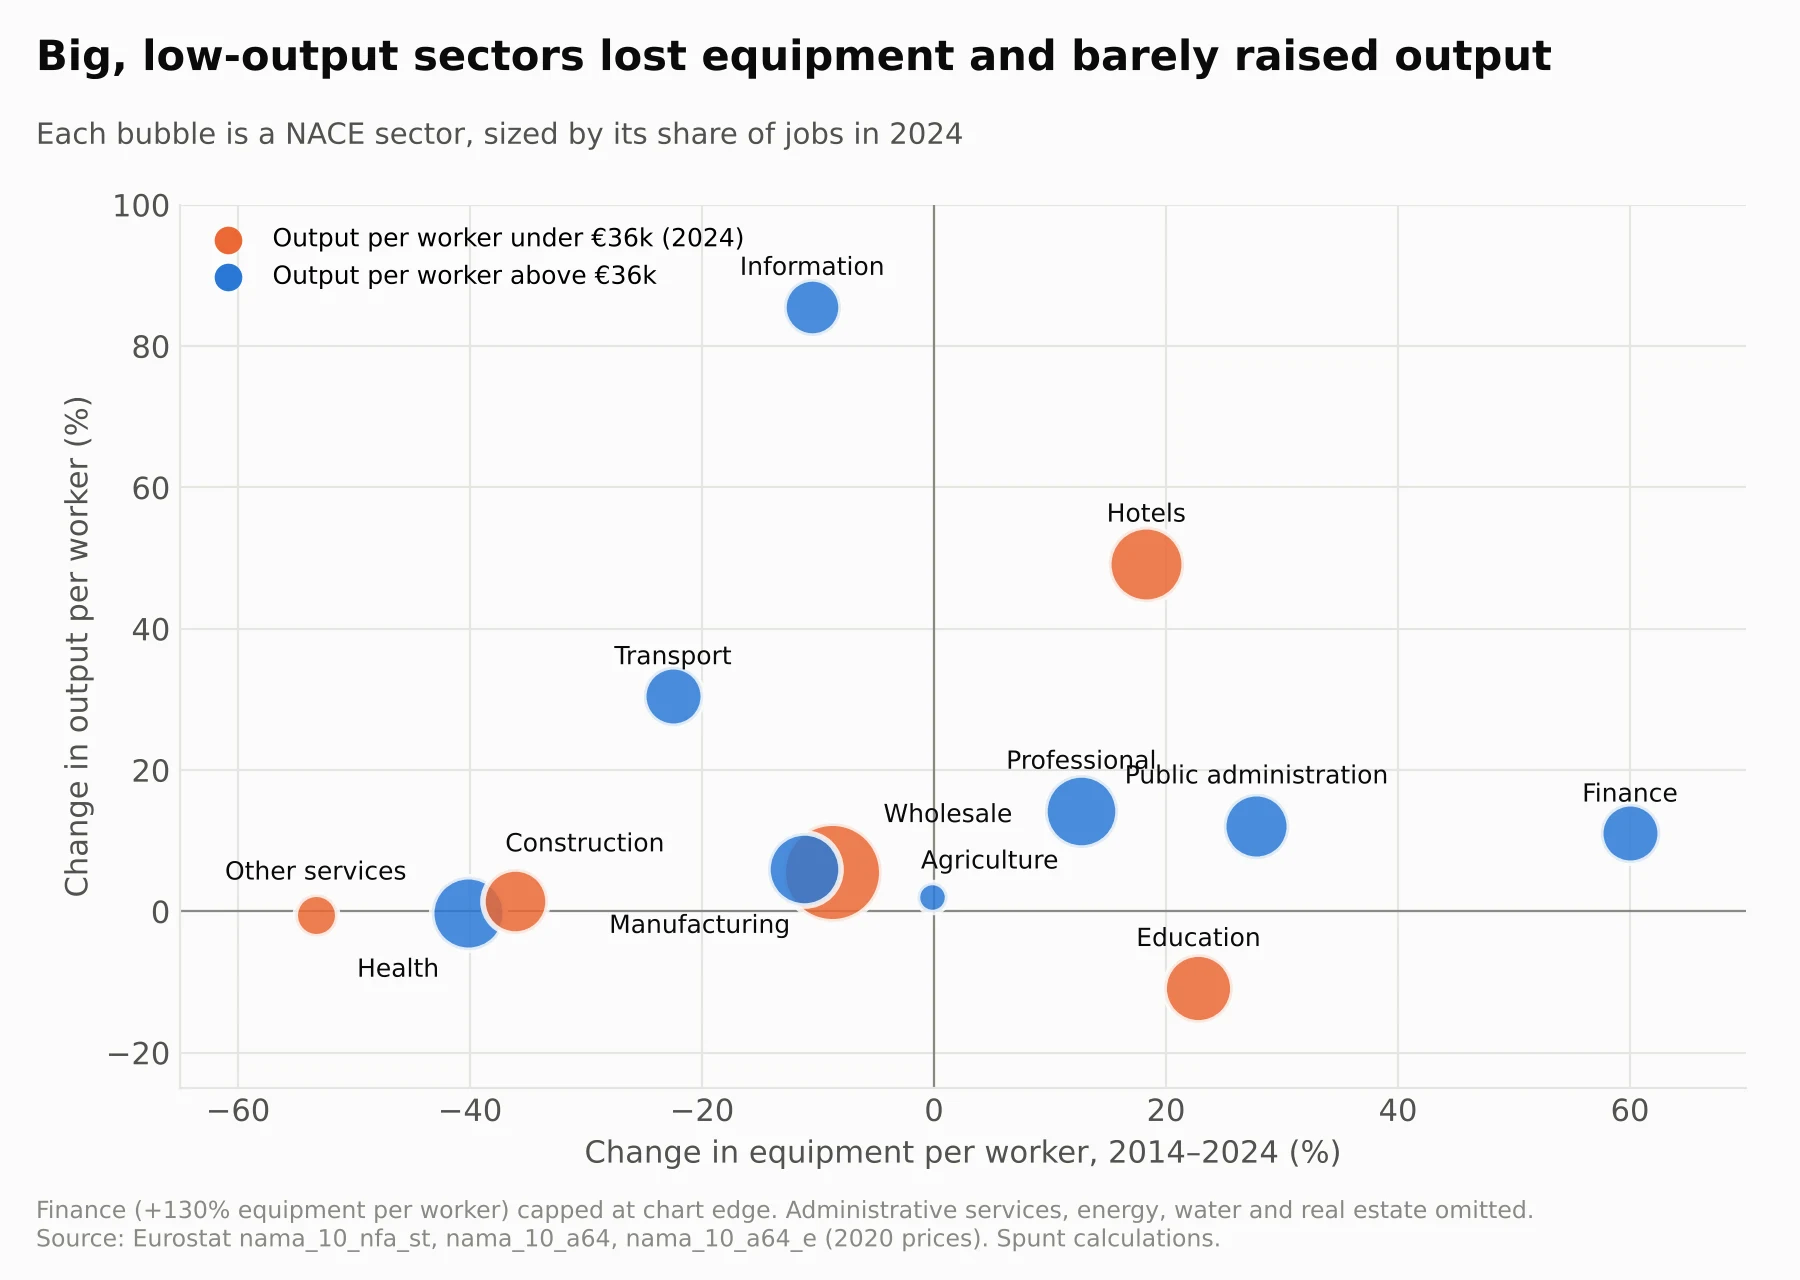
Malta’s is in a big part. Jobs and output are published for about 60 detailed industries, which shows where the new jobs actually went. The economy-wide average output per worker in 2024 was about €51,800 (excluding real estate). Industries producing less than 70% of that, under about €36,000 per worker, held 55% of all jobs in 2014. They still held 54% in 2024, and took 53% of the 127,000 new jobs. That is about 67,000 new jobs in the lowest-output part of the economy.
| Detailed industry (NACE) | Jobs, 2014 → 2024 | Share of all new jobs | Output per worker, 2014 → 2024 |
|---|---|---|---|
| N78 Employment and temping agencies | 3,620 → 13,740 | 8.0% | €25.4k → €20.4k |
| N80–82 Security, cleaning, office support | 9,640 → 18,970 | 7.4% | €19.2k → €24.3k |
| G47 Retail | 16,880 → 26,150 | 7.3% | €21.6k → €26.2k |
| F Construction | 10,660 → 19,680 | 7.1% | €33.5k → €34.0k |
| I Hotels and restaurants | 18,510 → 26,410 | 6.2% | €23.8k → €35.5k |
| Q86 Health care | 8,810 → 15,010 | 4.9% | €49.5k → €45.3k |
| O84 Public administration | 14,100 → 20,060 | 4.7% | €41.3k → €46.3k |
| P85 Education | 16,990 → 21,940 | 3.9% | €37.6k → €33.5k |
| R90–92 Arts, gaming | 4,090 → 9,040 | 3.9% | €257.1k → €130.7k |
| G46 Wholesale | 10,540 → 15,190 | 3.7% | €39.7k → €35.6k |
| Q87–88 Residential care, social work | 6,280 → 10,160 | 3.1% | €25.7k → €31.1k |
| K64 Banking and financial services | 7,430 → 11,320 | 3.1% | €79.5k → €77.4k |
The twelve detailed industries that added the most jobs. Output is gross value added per person employed, chain-linked 2020 euro. Source: Eurostat nama_10_a64 and nama_10_a64_e; Spunt calculations.
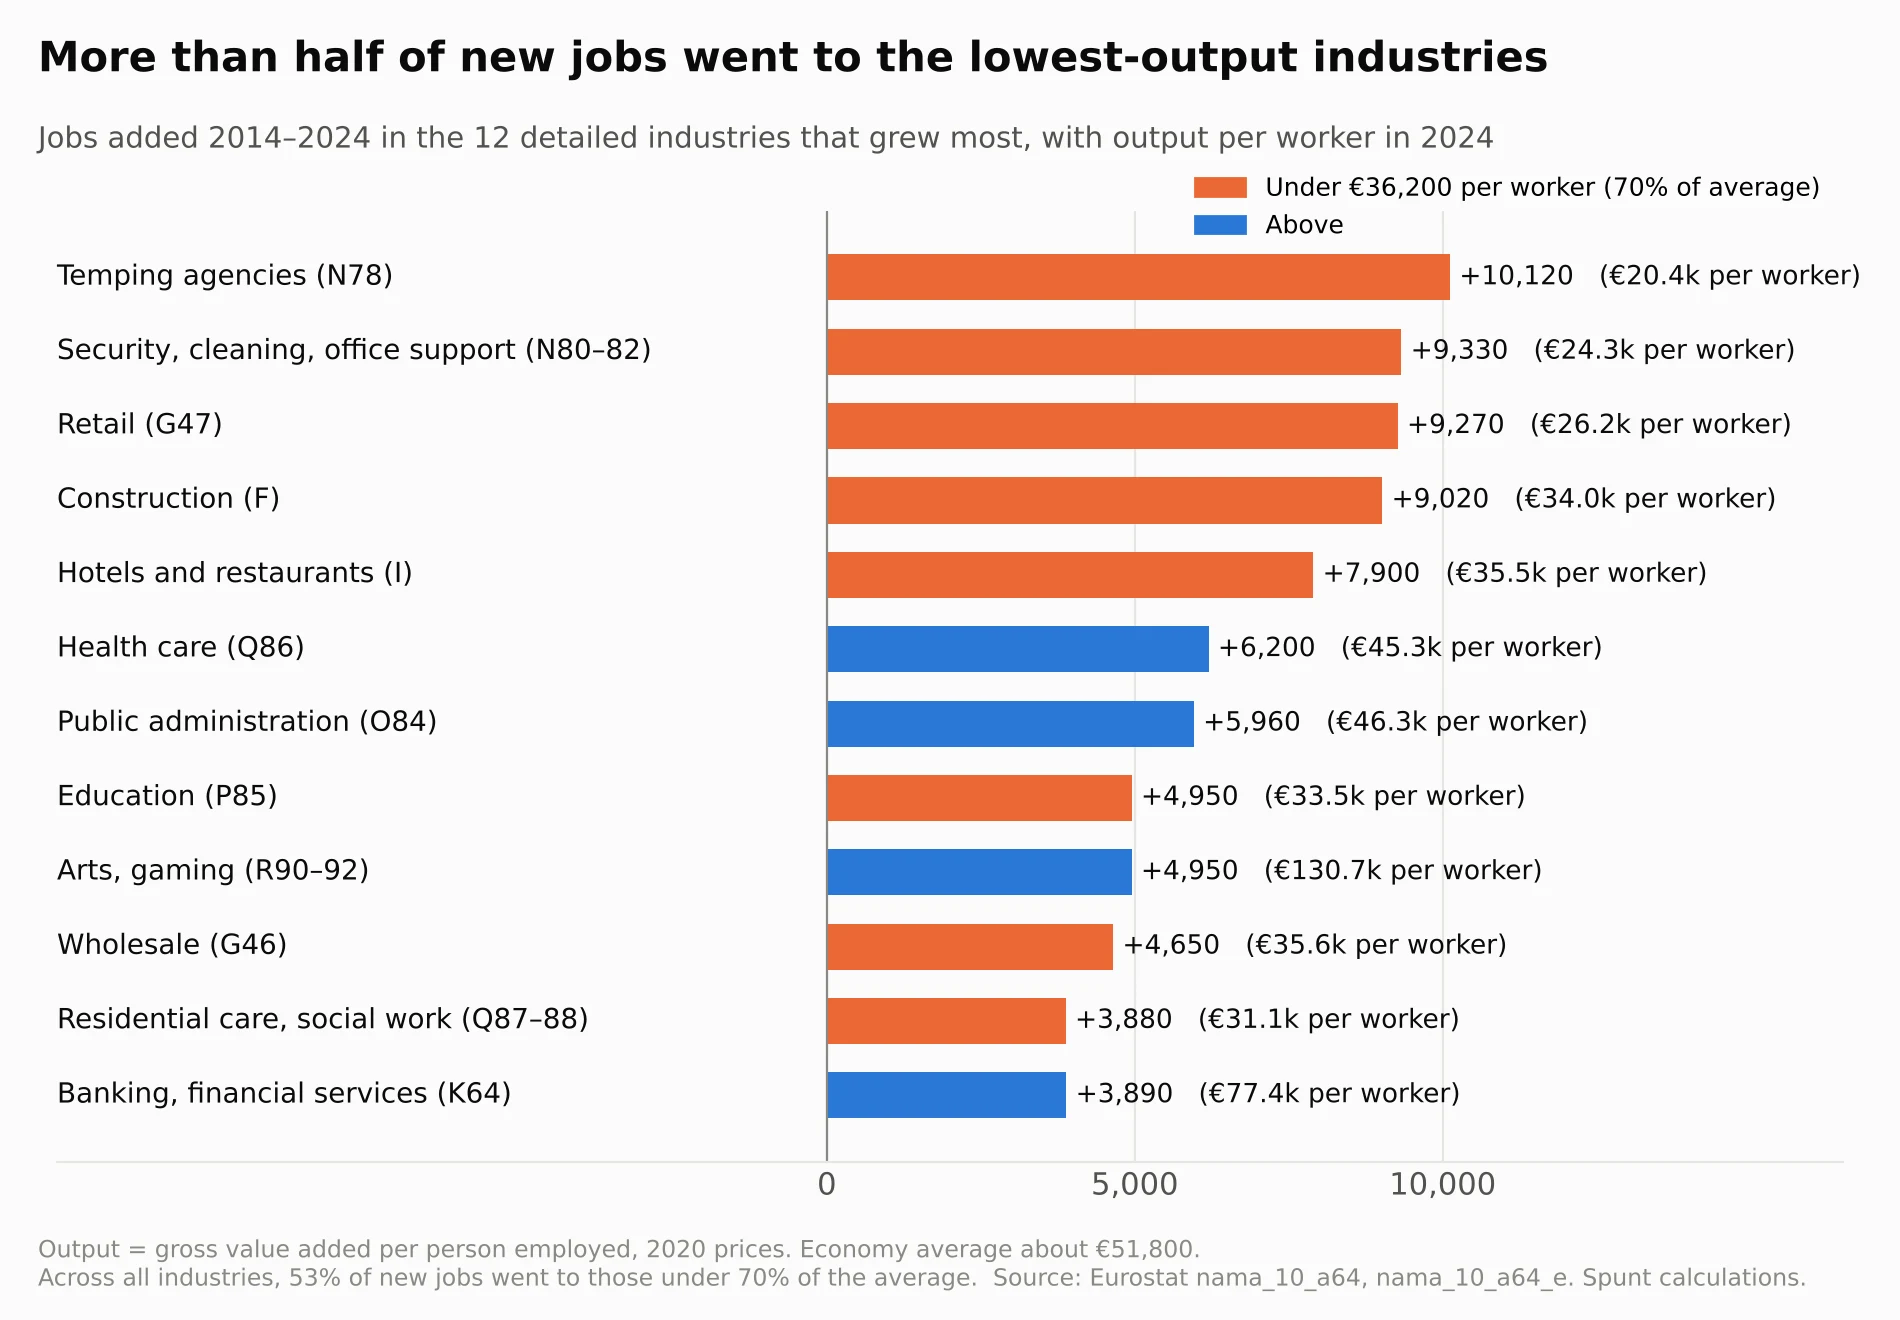
Three findings follow.
The low-output half of the economy did not shrink. In an economy moving towards higher productivity, its share of jobs should fall over a decade. Malta’s barely moved, from 55% to 54%.
Within it, the fastest-growing parts got worse. Temping agencies more than tripled, from 1.8% to 4.2% of all jobs, and their output per worker fell by a fifth. Security, cleaning and office support grew from 4.9% to 5.8% of jobs. Construction grew from 5.4% to 6.0%, with output per worker flat for ten years.
There is one bright spot. Hotels and restaurants took a smaller share of jobs (9.3% to 8.1%) while output per worker rose by half and equipment per worker rose by 18%. That sector moved the way the minister wants.
One caution about temping agencies. People employed through an agency are counted in the agency’s industry, even when they work in a hotel, on a building site or in a care home. So the agency figures partly hide where the work is done, and the sectors using agency staff have even more workers per unit of equipment than their own figures show.
How sensitive is the result?
The size of the fall depends on which capital-heavy activities are set aside, but the direction does not change.
| Excluding | Equipment per worker, 2014 → 2024 | Share of jobs covered |
|---|---|---|
| Nothing (whole economy) | +6% | 100% |
| Finance, administrative services, real estate | −7% | 82% |
| The above, plus energy and quarrying | −5% | 82% |
| The above, plus water, waste and public administration | −11% | 75% |
Same measure and sources as above. Section-level figures, which give slightly different totals from the whole-economy series.
The last row is the closest to “businesses” in the minister’s sense, since public administration carries roads and other state infrastructure. On that measure, equipment per worker fell by 11% while employment rose by more than half.
Workers got dearer, and firms hired anyway
One objection is that workers did not get cheaper. That is correct. Average pay in shops, transport, hotels and restaurants rose by 68% between 2014 and 2024, and in construction by 47%. The price of equipment rose by 33%. On those numbers, firms should have bought more machines.
They did not. The likeliest reason is that recruitment from abroad kept adding new workers, so firms could keep hiring at the going wage without bidding pay up further. Labour stayed cheap compared with what it would have cost without that supply. That comparison cannot be observed directly, so this part is an inference.
Evaluation
The minister said businesses choose workers over investment. For most of the economy the figures agree. Outside finance, administrative services and real estate, the equipment behind each worker fell by 8% in ten years while the workforce grew by 57%. Over the same period the fall in Malta was five times steeper than in the EU, while hiring ran five times faster.
The problem is not confined to a small corner. Industries producing well below the average hold more than half of all jobs, took more than half of the new ones, and their share did not shrink. The fastest growth was in temping agencies, cleaning and security, and construction.
The claim is less accurate in two ways. It does not hold for finance, professional services or information and communication, which added equipment or output per worker quickly. And “rather than invest” suggests businesses stopped investing, when Malta’s stock of equipment grew faster than most of Europe’s. Businesses did invest. They invested mainly to keep up with the number of people they were hiring, not to make each person more productive.
Editorial note
How we assessed this claim
We tested the result the claim predicts, not the motive behind it. The measure is non-residential fixed capital per person employed, at fixed 2020 prices, from Eurostat's national accounts, for 2014 and 2024 in Malta and for 2014 and 2023 across the EU. We checked the whole economy, the economy excluding finance, administrative services and real estate, and each major industry. For the claim to count as substantially true, equipment per worker had to stay flat or fall in the industries that took most of the new jobs.
It is not True because the headline figure for the whole economy rose, by more than the EU average, and because the claim's wording implies firms stopped investing, which they did not. It is not True but lacks context because the missing detail changes the picture of who invested and how much. It is above Misleading because, where more than four in five Maltese people work, equipment per worker fell sharply while the workforce grew faster than anywhere else in Europe.
Limitations
- Eurostat estimates capital stocks by adding up past investment and subtracting wear and tear. They are not counted directly.
- Equipment figures are published only for 18 sectors. Jobs and output are published for about 60 detailed industries, so the detailed analysis covers jobs and output but not equipment.
- People employed through temping agencies are counted in that industry, not where they work.
- Health, education and public administration are mostly public sector. The claim is about businesses, so the sensitivity table shows the result with public administration removed.
- Eurostat does not publish a separate figure for renting and leasing in Malta, so this fact check cannot confirm what drove the tenfold rise in administrative services.
- The EU comparison ends in 2023 because several countries, and the EU total, have no 2024 figure yet.
- Amounts in the European table are in euro at 2020 prices, not adjusted for price differences between countries, so the level comparison is indicative.
- Hours worked per person peaked in 2019 and have been lower since. Over 2014 to 2024 they changed little, so measuring per worker or per hour gives similar answers for the decade as a whole.
- Average pay in an industry is affected by changes in who works there and is not a clean measure of what the next hire costs.
- The figures show what businesses did, not why.
Sources
- Eurostat, Capital stocks by industry and detailed asset type (nama_10_nfa_st), Malta and EU countries, 2014 to 2024
- Eurostat, Employment by industry (nama_10_a10_e, nama_10_a64_e)
- Eurostat, Gross value added and income by industry (nama_10_a10)
- Eurostat, GDP and main components (nama_10_gdp), Malta, including the price index for gross fixed capital formation
- The Business Picture, report of the Minister for Finance's remarks (6 October 2026)